Performance
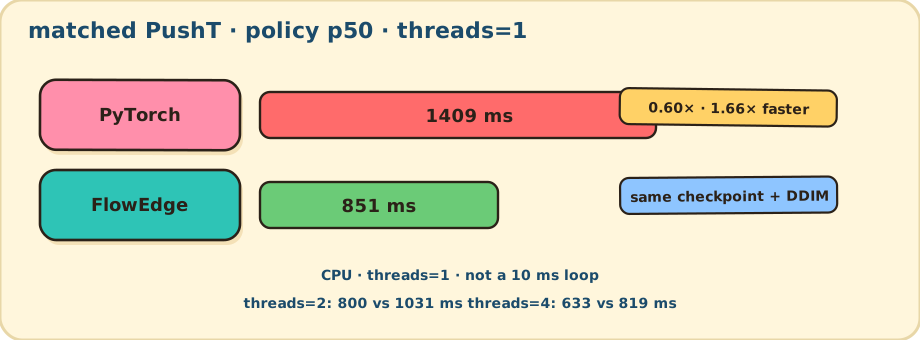
CPU. threads=1 is the fair compare. Lower latency is better.
Diffusion Policy
replay
· JSON
· threads=2
· threads=4
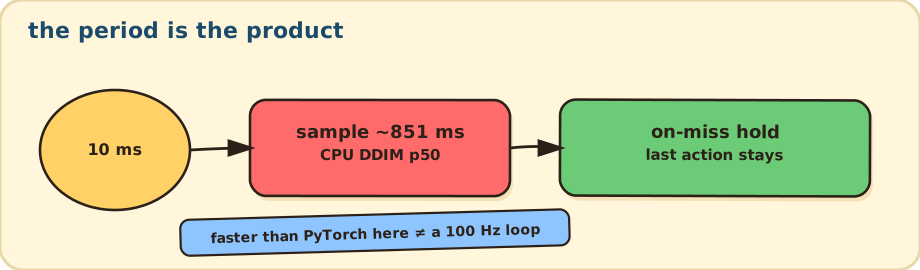
· period 10 ms hold
FlowEdge |
LeRobot / PyTorch |
|
|---|---|---|
Policy p50 |
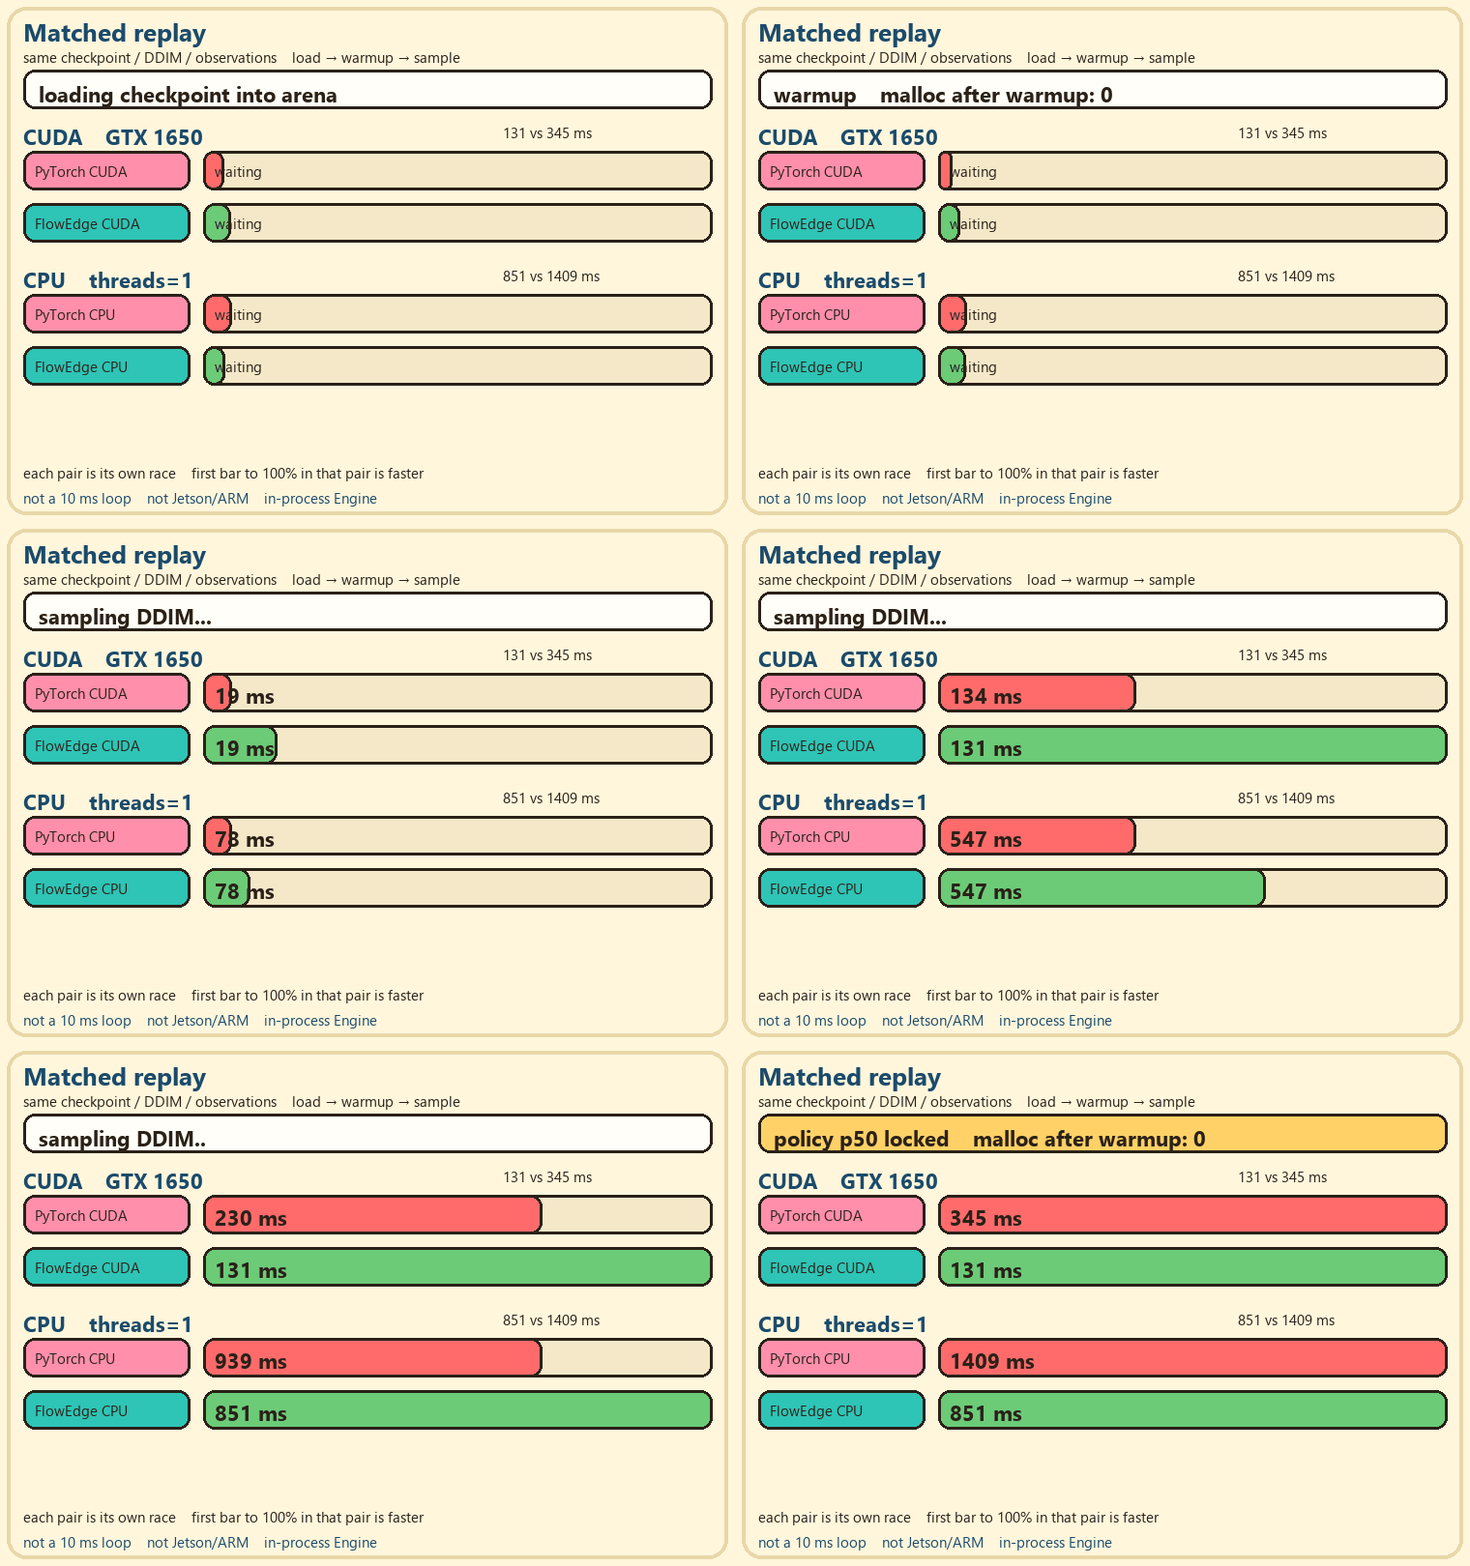
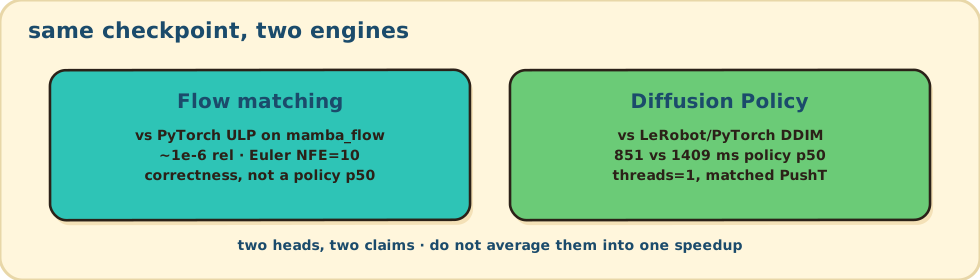
851 ms |
1409 ms |
Preprocess-to-chunk p50 |
889 ms |
1448 ms |
Max abs action error |
3.05e-5 |
— |
FlowEdge / LeRobot |
0.60× |
Threads |
FlowEdge policy p50 |
LeRobot policy p50 |
FlowEdge / LeRobot |
Native DDIM p50 |
|---|---|---|---|---|
1 |
851 ms |
1409 ms |
0.60× |
810 ms (pool 0) |
2 |
800 ms |
1031 ms |
0.78× |
714 ms |
4 |
633 ms |
819 ms |
0.77× |
567 ms |
6 |
— |
— |
— |
565 ms |
Period |
On miss |
Misses |
Step p50 / p99 / max |
|---|---|---|---|
10 ms |
hold |
20 / 20 |
655 / 812 / 834 ms |
Case |
Before p50 |
Current p50 |
Speedup |
4 workers |
|---|---|---|---|---|
Conv1D 512×512, K5, L16 |
29.3 ms |
9.21 ms |
3.18× |
3.30 ms |
Conv1D 1024×1024, K5, L8 |
57.9 ms |
31.6 ms |
1.83× |
11.0 ms |
Conv1D 2048×2048, K5, L4 |
118 ms |
108 ms |
1.09× |
41.3 ms |
Strided Conv1D 512×512, K3, L16→8 |
9.61 ms |
5.78 ms |
1.66× |
— |
ConvTranspose1D 512×512, K4, L8→16 |
10.5 ms |
6.00 ms |
1.75× |
— |
Native DDIM |
p50 |
|---|---|
pool 0 |
810 ms |
2 workers |
714 ms |
4 workers |
567 ms |
6 workers |
565 ms |
CUDA Diffusion Policy
NVIDIA GeForce GTX 1650 is the headline, not threads=1. Same observation file as the CPU replay. Not TensorRT/ONNX. Not Jetson/ARM.
FlowEdge CUDA |
PyTorch CUDA |
|
|---|---|---|
Policy p50 |
131 ms |
345 ms |
Preprocess-to-chunk p50 |
136 ms |
350 ms |
Max abs action error |
7.63e-5 |
— |
FlowEdge / LeRobot |
0.38× |
A 4GB card cannot hold both U-Nets; the runner frees FlowEdge before loading the PyTorch U-Net. Same observation file as the CPU replay. The CPU threads=1 851 vs 1409 ms figure is unchanged. Not TensorRT/ONNX. Not Jetson/ARM.
Period |
On miss |
Misses |
Step p50 / p99 / max |
|---|---|---|---|
10 ms |
hold |
20 / 20 |
589 / 1571 / 1795 ms |
Synthetic encoded zeros, no warmup, GTX 1650. Miss counts, not task success. Not Jetson/ARM. This period JSON is the #164 log, not the split-K replay.
Native 10-step DDIM on the same GTX 1650, same checkpoint, flowedge_cuda_dp_mix
(cudaEvent p50, not policy p50, not vs PyTorch):
Kernel |
Before p50 |
After p50 |
After ms/sample |
|---|---|---|---|
conv 512 L16 K5 |
326 us |
215 us |
8.6 |
conv 2048 L4 K5 |
3567 us |
2486 us |
174 |
upsample 1024 L4→8 K4 |
1392 us |
277 us |
2.8 |
upsample 1024 k-major |
1684 us |
386 us |
3.9 |
native DDIM ×10 |
448 ms |
321 ms |
321 |
Short-horizon launch (block.x matches L) and closed-form conv_transpose1d (#174).
Warp split-K on L=4 and L=8 (lanes split IC, one block per output channel). L=16 stays on the 2D launch; split-K lost there twice.
Kernel |
#174 p50 |
split-K p50 |
ms/sample |
|---|---|---|---|
conv 512 L16 K5 |
215 us |
215 us |
8.6 |
conv 1024 L4 K5 |
686 us |
235 us |
7.0 |
conv 2048 L4 K5 |
2486 us |
885 us |
62 |
native DDIM ×10 |
321 ms |
152 ms |
152 |
One native DDIM sample launches 1490 device ops. conv 2048 L4 is 70 of them (the CPU xN was right). GroupNorm is 250 launches across five shapes, not the mix’s old x80. FiLM GEMM is 1×260×C, not the packed 4×10240×2048 isolate.
Block-per-group GroupNorm (#179):
Kernel |
split-K p50 |
block GN p50 |
ms/sample |
|---|---|---|---|
group_norm 2048 L4 |
118 us |
10 us |
0.8 |
native DDIM ×10 |
156 ms |
136 ms |
136 |
Matched policy p50 is 131 ms vs 345 ms on this same host after the GroupNorm launch change (replay JSON regenerated; encoder still in LeRobot).
L=8 split-K, 256-thread L=4, k-major upsample split-K, and a rows=1 GEMM launch, measured on a cooler GTX 1650 clock than the 136 ms GN run. Compare to this session’s mix baseline, not to 136 ms:
Kernel |
session before |
after |
ms/sample |
|---|---|---|---|
conv 1024 L4 K5 |
234 us |
196 us |
5.9 |
conv 2048 L4 K5 |
935 us |
748 us |
52 |
conv 512 L8 K5 |
193 us |
102 us |
3.1 |
conv 1024 L8 K5 |
664 us |
336 us |
10.1 |
upsample 1024 k-major |
489 us |
315 us |
3.1 |
gemm 1x260x4096 |
98 us |
76 us |
3.0 |
native DDIM ×10 |
266 ms |
174 ms |
174 |
L=16 split-K was rejected (215→897 us; native 183→229 ms). Same-day matched replay on this clock was 158 vs 434 ms, max abs 3.05e-5; that does not replace the published 131 vs 345 JSON. Next pick is still conv 2048 L4 (70 launches).
How to get them
python -m flowedge_dev bench policy models/diffusion_pusht.flowedge.safetensors \
  --source models/diffusion_pusht --threads 1

python -m flowedge_dev pipeline rollout models/diffusion_pusht.flowedge.safetensors \
  --steps 20 --threads 4 --period-ms 10 --on-miss hold

python -m flowedge_dev bench mix

cmake -S . -B build-diffusion-perf -DCMAKE_BUILD_TYPE=Release \
  -DFLOWEDGE_BACKEND=cpu -DFLOWEDGE_BENCH=ON
cmake --build build-diffusion-perf --target flowedge_kernels_bench -j2
./build-diffusion-perf/flowedge_kernels_bench \
  --benchmark_filter='BM_diffusion_' --benchmark_min_time=0.2s \
  --benchmark_repetitions=5 --benchmark_report_aggregates_only=true
CUDA matched replay (WSL, FLOWEDGE_BACKEND=cuda, PyTorch CUDA):
python -m flowedge_dev bench policy models/diffusion_pusht.flowedge.safetensors \
  --source models/diffusion_pusht --revision 84a7c23178445c6bbf7e1a884ff497017910f653 \
  --steps 10 --iterations 10 --warmup 2 --threads 1 --device cuda \
  --observations bench/artifacts/policy/diffusion-pusht-cpu-replay.observations.npz \
  --build-dir /path/to/cuda-build \
  --output bench/artifacts/policy/diffusion-pusht-cuda-replay.json
CUDA Core period loop (same --on-miss contract; miss counts, not a policy p50):
python -m flowedge_dev pipeline rollout models/diffusion_pusht.flowedge.safetensors \
  --steps 20 --threads 1 --period-ms 10 --on-miss hold --device cuda --host-facts \
  --output bench/artifacts/policy/diffusion-pusht-cuda-period10-hold.json
CUDA DP kernel mix (WSL, FLOWEDGE_BACKEND=cuda, GTX 1650 sm_75):
./build-cuda/flowedge_cuda_dp_mix models/diffusion_pusht.flowedge.safetensors
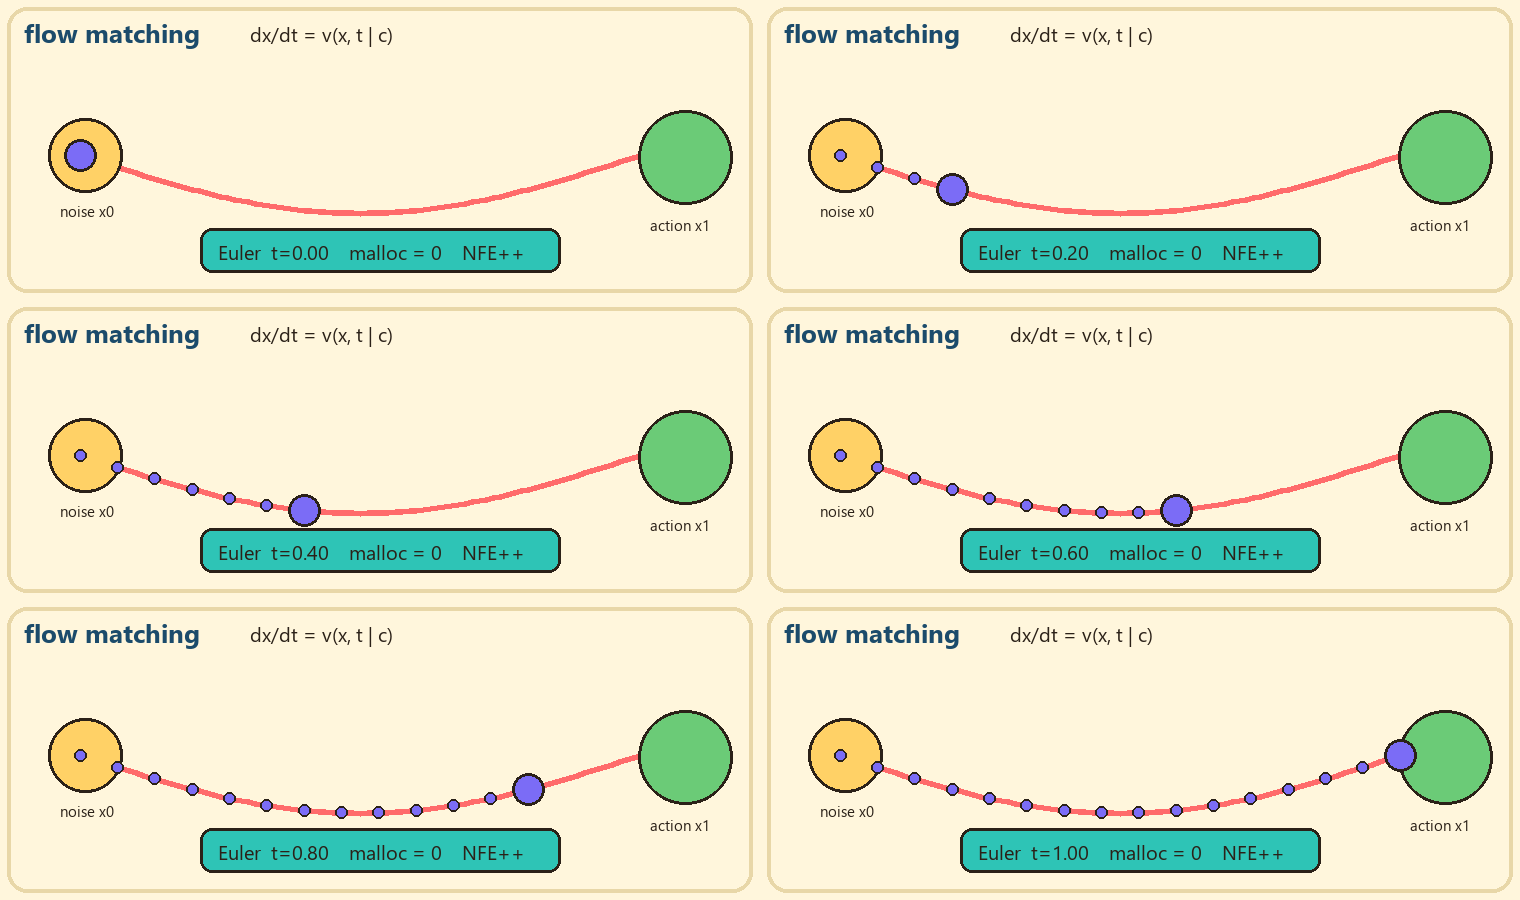
Flow matching
Value |
|
|---|---|
Checkpoint |
|
Max rel-error vs PyTorch |
~1e-6 |
Rel-error gate |
2e-3 |
ULP gate |
4096 |
Prefix |
|
Matched policy p50 |
— |
There is no published flow-matching policy p50. The default head is gated by ULP
(~1e-6 rel vs the same PyTorch reference). Do not treat that prefix check as a
robot number. A matched replay vs PyTorch would be the measurement if one is
needed; flow_sample wall time is not it.
How to get them
python -m flowedge_dev verify ulp models/mamba_flow.safetensors
./build/flow_sample models/mamba_flow.safetensors euler 10
Relay
Benchmark |
Windows |
Linux |
|---|---|---|
Synchronous p99 |
47.60 us |
40.10 us |
Pool, 1 worker |
37,240 req/s |
55,719 req/s |
Pool, 2 workers |
73,187 req/s |
109,507 req/s |
How to get them
./build/flowedge_relay_bench models/mamba_flow.safetensors 5000 0
./build/flowedge_relay_pool_bench models/mamba_flow.safetensors 5000 1 0
./build/flowedge_relay_pool_bench models/mamba_flow.safetensors 5000 2 0

FLOWEDGE_BUILD_DIR=build-relay \
FLOWEDGE_RELAY_BENCH_REPORT_DIR=bench-results \
./scripts/relay_bench.sh models/mamba_flow.safetensors
.\build\flowedge_relay_bench.exe models/mamba_flow.safetensors 5000 0
.\build\flowedge_relay_pool_bench.exe models/mamba_flow.safetensors 5000 1 0
.\build\flowedge_relay_pool_bench.exe models/mamba_flow.safetensors 5000 2 0
$env:FLOWEDGE_BUILD_DIR="build-relay"
$env:FLOWEDGE_BUILD_JOBS="2"
$env:FLOWEDGE_RELAY_BENCH_REPORT_DIR="bench-results"
.\scripts\relay_bench.ps1 models\mamba_flow.safetensors
Cooperative jobs
Benchmark |
Windows |
Linux |
|---|---|---|
Migrate and finish |
478.56 ns/job |
292.08 ns/job |
Direct route, run, and return |
274.80 ns/job |
88.94 ns/job |
EDF pool + lifecycle metrics |
3.49 us/job |
1.19 us/job |
Shared-memory client/service + pool + metrics |
4.60 us/job |
1.78 us/job |
Deadline queue |
Before |
Current |
Speedup |
|---|---|---|---|
Windows |
4.62 us/job |
1.36 us/job |
3.40× |
Linux |
2.85 us/job |
1.22 us/job |
2.33× |
Mamba stream adapter |
Direct |
Generic route |
Migrate after token 2 |
|---|---|---|---|
Windows |
108.16 us/job |
109.54 us/job |
114.32 us/job |
Linux |
115.74 us/job |
115.85 us/job |
129.32 us/job |
Worker drain |
Mean |
p50 |
p99 |
|---|---|---|---|
Windows |
34.24 us |
5.80 us |
144.20 us |
Linux |
52.41 us |
54.54 us |
108.81 us |
Action delivery |
Accept + publish / step |
Replace + blended publish |
|---|---|---|
Windows |
49.13 ns |
225.63 ns |
Linux |
60.75 ns |
306.73 ns |
QoS rejection |
Latency |
|---|---|
Windows |
114.481 ns |
Linux |
65.6609 ns |
How to get them
./build/flowedge_cooperative_job_bench 1000000
./build/flowedge_job_queue_bench 3000
./build/flowedge_mamba_stream_bench models/mamba_flow.safetensors 1000
./build/flowedge_worker_drain_bench 10000
./build/flowedge_action_delivery_bench 1000000
for i in 1 2 3 4 5; do ./build/flowedge_job_qos_bench 1000000; done
.\build\flowedge_cooperative_job_bench.exe 1000000
.\build\flowedge_job_queue_bench.exe 3000
.\build\flowedge_mamba_stream_bench.exe models\mamba_flow.safetensors 1000
.\build\flowedge_worker_drain_bench.exe 10000
.\build\flowedge_action_delivery_bench.exe 1000000
1..5 | ForEach-Object { .\build\flowedge_job_qos_bench.exe 1000000 }
Budgets
FLOWEDGE_BUILD_DIR=build-all ./scripts/verify_all.sh models/mamba_flow.safetensors
cat build-all/budget-report.md
bench/config/budget-baseline.json records the named Release configuration,
measured revisions, and rationale for the current thresholds. Rebaseline only
after comparing the old and new revisions with the same toolchain. The static
archive byte count includes compiler- and archive-format overhead, so it is a
review signal for that configuration rather than a portable code-size metric.